Interface v4.2
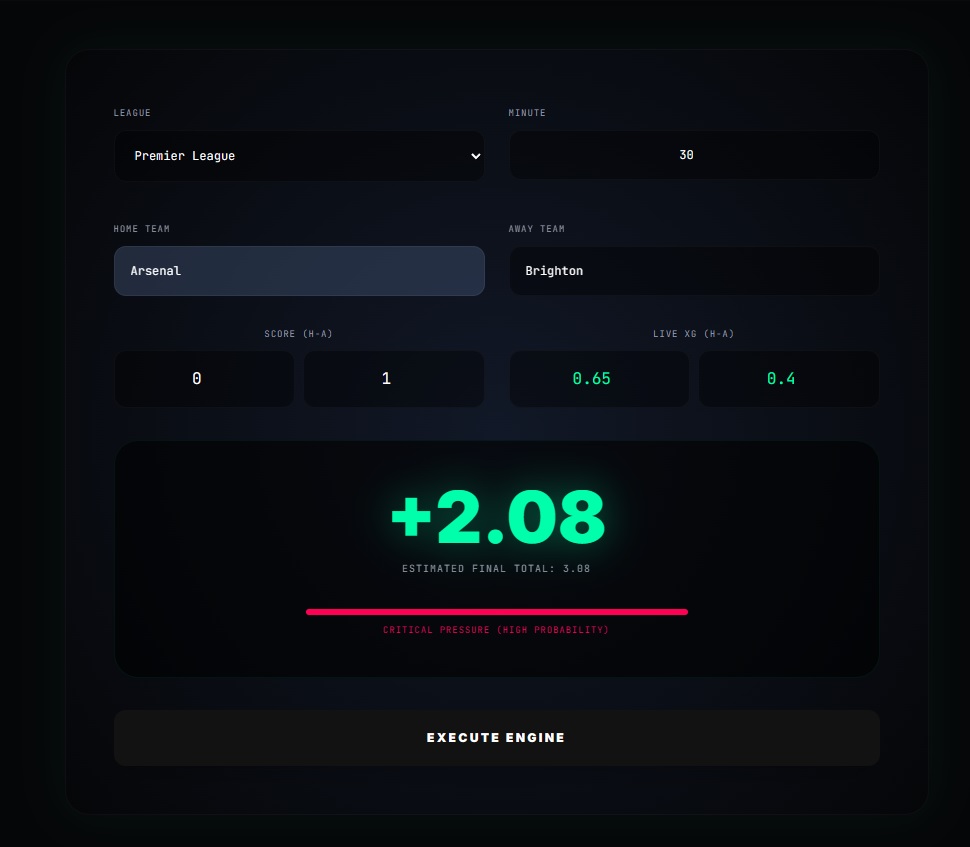
Live Terminal View
Direct Neural Control
Input live match data directly into the terminal. Our engine processes the league context, team form, and minute-by-minute xG to output a raw probability score — exclusively trained on the top 5 European leagues.
14ms
Latency
98.4%
Uptime
Visual Logic
The system visualizes pressure using a dynamic bar graph. When probability exceeds 75%, the interface alerts you to a high-value entry point — across all 5 leagues in real time.
- Real-time momentum tracking
- Color-coded risk indicators
- Instant calculation engine
- 5 elite leagues covered
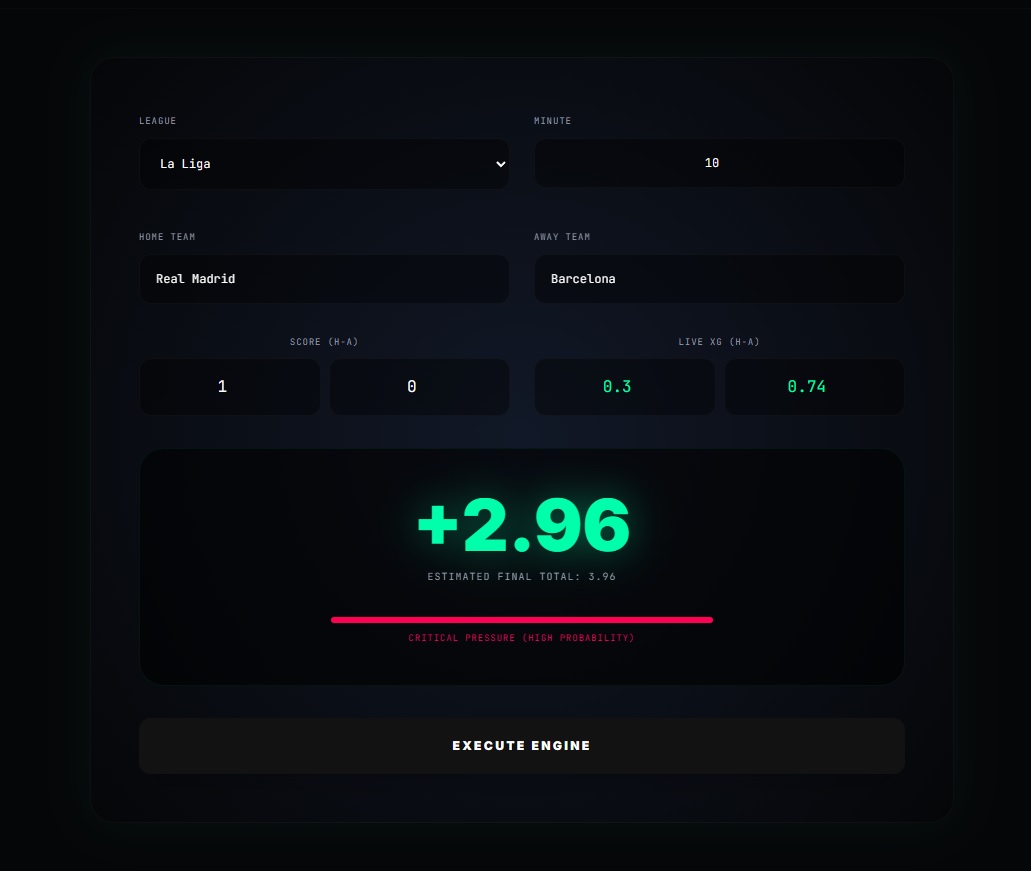
Visualizer
Probability Output